News for Students and
Teacher Resources
Grades 6-12


Lessons are available for STEM and non-STEM subjects to help students become civic-minded problem solvers. Click here to find resources that fit your learning goals.
Classroom features daily news lessons based on PBS News Hour, full-length video-based lesson plans and opportunities for teachers and students to be published on Classroom Voices
Featured Resources:

STEM
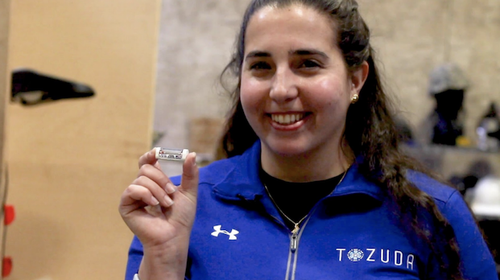
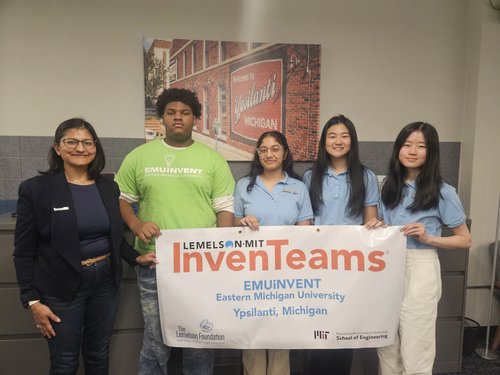
Student voice: When it comes to invention, don’t be afraid to ask for help
Ifeoma Okolo and Austin Ewing, tenth grade students from Illinois, are learning about intellectual property through their experience as student inventors and budding engineers


Be Informed. Stay Engaged.
We'll send you ready-to-go current events lessons each morning
Sign up
Journalism in Action
Civic Engagement and Primary Sources Through Key Moments in History
The Journalism in Action website allows students to investigate the role journalism has played in U.S. history and what it means to have a free press.
Using the Library of Congress' databases, students analyze primary sources ranging from Civil War photographs to broadcasts of the Watergate hearings.


SUPPORTED BY VIEWERS LIKE YOU. ADDITIONAL SUPPORT PROVIDED BY:
Copyright © 2025 News Hour Production LLC. All Rights Reserved
Illustrations by Annamaria Ward