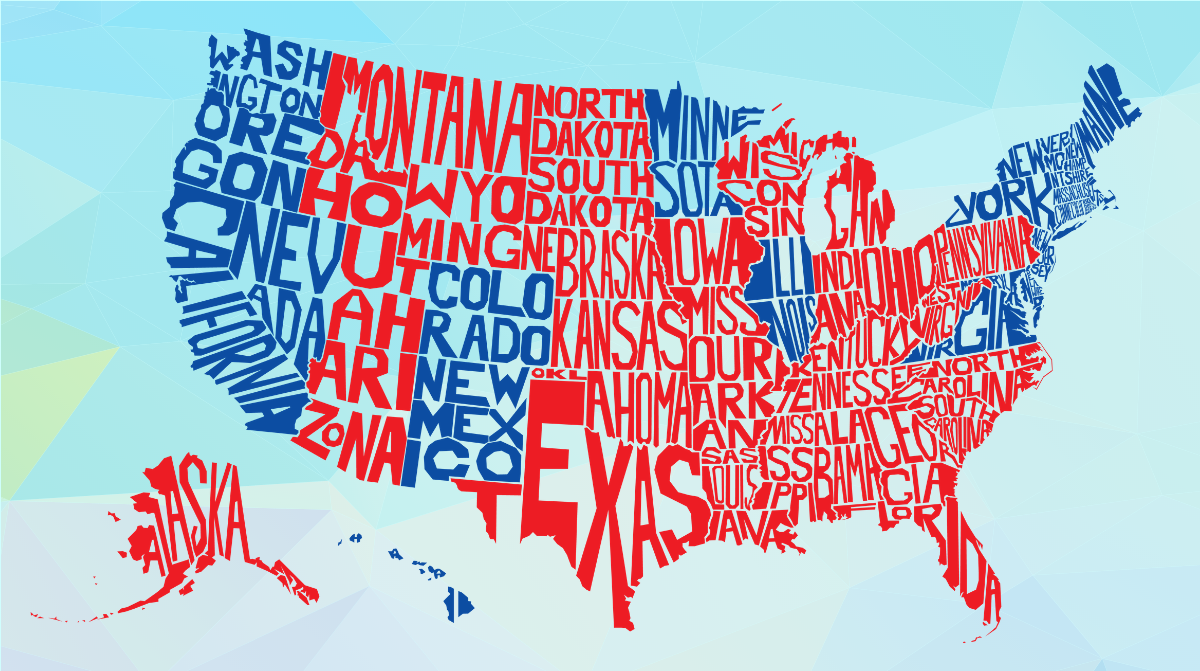
As a long time social studies educator, it is cliche and almost obligatory that I love maps. My joy in pouring over a map is not limited to determining my destination and defining the clearest route but rather in learning the stories that a good map tells. Many of us can hearken back to a day when large maps occupied significant wall space in classrooms. They not only outlined the 50 states but they followed the paths of warring armies and the spread of religions. A good map reveals much more than borders and landforms. The Electoral College map, for example, gives essential clues to our national character. Looking at changes in the Electoral College map over time, we can trace the political development of the United States, changes in demographics, the struggle for voting rights, and the pain and triumph of a country.
Getting to Know the Powerful PBS Electoral Decoder
Electoral College maps help students meld history and government concepts. We follow, in four-year cycles, the values we hold and what changes are afoot. ThePBS Electoral Decoder, part of the extensive Election Centralcollection of PBS LearningMediaclassroom resources, is a fantastic tool to help students unearth these stories. The tool is simple but powerful. Students can explore every presidential election to see the Electoral College results, either on the political map of the United States or as a cartogram, which allows students to see the relative size and weight of each state’s electoral vote. Teachers should encourage students to use both features. In particular, the cartogram helps students visualize state population and shifts in population over time.
What’s a “Swing State”?
It also gives clues as to why some states receive more attention from presidential candidates. Why are people in Georgia, Wisconsin, and Arizona seeing almost nothing but campaign ads on television and streaming services? Why do large states like California, Texas, and New York seem to be ignored by presidential candidates? Why has Pennsylvania received more campaign visits and ad spending than any other state? As the largest of the “swing states,” there are 20 (electoral vote) reasons why. As students toggle from election to election, they can see the country grow and examine how political alliances emerge and fade with the passage of time. Each election is accompanied by an explanation of the key candidates and issues along with a short timeline of important events in the intervening years. It is a practical and powerful tool.
Learning, Predicting and Sharing
Here are a few suggestions for using the Electoral Decoder in your class. With civics and government students, have your students look for trends. Which party dominates which region? Why do particular candidates have success in certain places? How have the “swing states” changed over time? These are stories that are accompanied by television advertisements and campaign visits, debate gaffes, and party platforms. Explore answerable questions like, “If Ross Perot received almost 20% of the vote in 1992, why doesn’t he show up on the map?” and unanswerable ones like, “What would have happened if Hillary Clinton had visited Wisconsin in 2016? This last one was of particular interest to my students in Madison, Wisconsin. In the days leading up to the election, have your students create their own electoral map predictions based on analysis of historical elections and more recent polling data. Students can even share their predictions right from the Electoral Decoder tool.
Exploring Historical Shifts in Voting Through the Years
In history classes, the Electoral Decoder becomes a tool for just that, decoding. Like any good historian-in-training, students search for clues to help them uncover greater mysteries. Why did the Southern states disappear from the map in 1864? Why are Republicans able to win in Southern states from 1868 to 1876, and then not again for another 50 years? Only four times in the last one hundred years has a “third party” won a state. Who were these people and what did they believe? What do their stories reveal about the divisions and struggles of Americans? Beyond the shifts in who people voted for, what can you learn about the United States and how can you prove it? As an example, in 1920, California had the same number of Electoral votes as Wisconsin. One hundred years later, it has more than five times as many. What can this tell us about the nation and its people?
The tools we provide to students are important. The best tools allow students to explore — to answer some questions and to uncover new ones and to build critical thinking skills. The PBS Electoral Decoder allows students to analyze data in a clear manner while still challenging them to discover for themselves. For many teachers in this election season, teaching about politics can be nerve-wracking. How do we make sure that we are helping our students gain essential knowledge and skills without drawing the ire of people who want politics out of the classroom? My hope is that classroom resources that allow students to flex their inquiry muscles, allowing them to investigate cause and effect or change over time, will alleviate some of the pressure on educators to have all the answers. You can also check out Retro Report’s Citizen Nation: Civics Skills collection on PBS LearningMedia. You’ll find some great tools for building research skills, cultivating civil discourse in your classroom, and encouraging students to be active and engaged citizens.
Using Critical Thinking Skills to Uncover Election Secrets
The Electoral Decoder strikes the right balance for students. It provides context and background but it doesn’t give away its secrets. Students need to do their own digging, and if supported with the right questions, they can not only find answers to our national mysteries but they can discover a few of their own. Hopefully, if teachers encourage exploration and provide the right levels of support, we can create a new generation of map lovers and critical thinkers. Encourage your students to explore historical elections and think about how those elections might influence today’s map. What will the 2024 race bring? What states may shift and will old political alliances hold? Challenge your students to use critical thinking, make their own predictions, and then share ideas with others.
PBS LearningMedia has curated free, standards-aligned videos, interactives, lesson plans and more for teachers to support teaching civics and elections. The Electoral Decoder is part ofPBS LearningMedia’s Election Central, an extensive array of resources for teachers and students which allows for exploration of all 58 past presidential elections from 1789-2016. In the support materials, background information and activities created by PBS NewsHour Classroomencourage students to examine how the Electoral College has shaped previous presidential elections. Using the Electoral Decoder, students can make calculated guesses about how the electors will vote in the 2024 presidential election.