by Allen Hillery

As I prepared to deliver my talk, I couldn’t help but reflect on all the moments that brought me here.
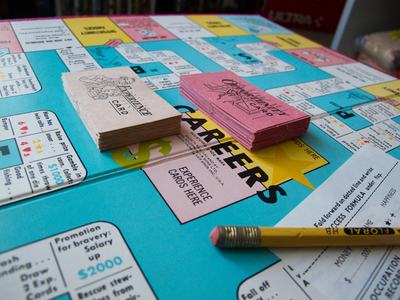
On Feb. 24, 2023, I delivered a virtual keynote address for a W.E.B. Du Bois Day celebration at the Atlanta University Consortium. It was an exciting and humbling experience for me. For starters, the event was being held at Clark Atlanta University. This school was formerly named Atlanta University, the same campus where Du Bois notably created a famed school of sociology and where Du Bois put the progress of Black America post emancipation on center stage.
February 2019
I had just left my corporate job and writing data-related blog posts had become a healthy outlet to process my thoughts. I wanted to write an article on data and reached out to a few people about recommendations on a topic at the intersection of data and Black History.
A couple of people mentioned Du Bois' data visualizations. How did I not know about this? A prolific writer, civil rights activist and co-founder of the NAACP had led a team of sociology students to create 60+ data visualizations for a world expo?
As a teacher of data storytelling, Du Bois’ visualizations are a master class.
The answer is most people would not have heard about it. These data visualizations had been archived by the Library of Congress in the early 1900s. It was announced in 2014 that a project to digitize the collection had begun. In 2017, they were released to the world. Many people in the data visualization space marveled on the intricacy of the Du Bois visualizations.
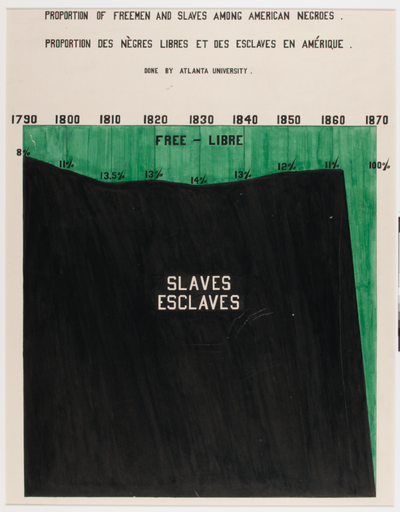
These visualizations were hand-drawn and poster-sized to make conference attendees take notice of their message. Du Bois used bold coloring and lettering to show the growth and resilience of Black America. He spotlighted population growth as well as increased educational attainment and land ownership.
As a teacher of data storytelling, Du Bois’ visualizations are a master class. This collection tells a story of resilience. He allows the data to speak for itself. He accentuates his points through vibrant colors and bold letterings. Du Bois’ message was clear — given the opportunity, Black Americans could be just as educated and obtain the “American Dream” in spite of the hurdles strategically placed to hinder their path.
February 2021
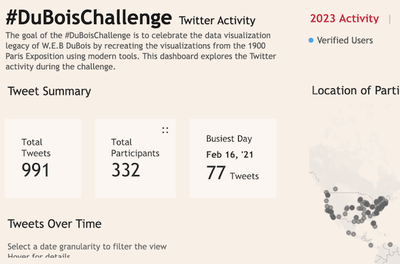
My colleagues Anthony Starks, Sekou Tyler and I decided to host a social media challenge on Twitter where participants would recreate Du Bois iconic visualizations. The challenge would run officially for 10 weeks. Each week we would highlight recreations that wowed us.
We all felt it was important to acknowledge Du Bois’ impact and contribution to data visualization since he’s not usually part of the narrative. We didn’t know what to expect from launching this challenge.
We figured that this challenge would appeal to data visualization enthusiasts, but we saw so many more communities engaging, including sociologists and those in the humanities. We had middle school and high school teachers reach out to us who wanted to have us speak about Du Bois’ life and the inspiration behind the challenge. A lot of teachers wanted to show their students how to use social media as a megaphone.
February 2022
We began outlining ideas for “Du Bois Bootcamps” where we would build tutorials for participants to recreate the visualizations. Ultimately though, I realized that I wanted to take things even deeper. I really wanted to celebrate the reason Du Bois created those visualizations — to celebrate the achievements of the Black community.
Du Bois' efforts to dispel racist and Social Darwinist thinking built a foundation for the way sociologists would come to analyze communities across America.
Du Bois' efforts to dispel racist and Social Darwinist thinking built a foundation for the way sociologists would come to analyze communities across America. Du Bois used demographic data combined with historical context to show how factors including slavery, Jim Crow and redlining had impacted Black communities.
At this time, I got the opportunity to teach my first college course on Du Bois’ sociological approach!
February 2023
As I was delivering the keynote address at the Atlanta University Consortium, I could tell the talk was being well received. The audience had the same look of wonder I had when I first learned about his visualizations. They were amazed about the work he and his team had created. I was able to share with them articles that team had written.
I also introduced a new member to the team — Chimdi Nwosu has recreated several of Du Bois’ visualizations. He’s also put together a YouTube channel with video tutorials for others to learn how to recreate them.
My Du Bois journey has been one of rediscovery. I’ve learned a lot about myself as a storyteller and educator. One of the many highlights of this journey has been the collaborations. I’m currently working with a professor at Fisk University who is teaching her class about data at the intersection of social justice. This journey has really opened my eyes to the world. #DuBoisChallenge is only just the beginning.
Allen Hillery is the co-founder of Be Data Lit, an educational resource for data literacy advocates. Hillery's data career spans 20 years in data and analytics. In addition to launching BDL, Allen is an adjunct professor who develops training programs and hosts workshops on data literacy and data storytelling.
If you'd like to contribute an Educator Voice piece, write to education@newshour.org with your idea.