Galileo's Battle for the Heavens
|  |
Student Handout |
Plotting the Spots
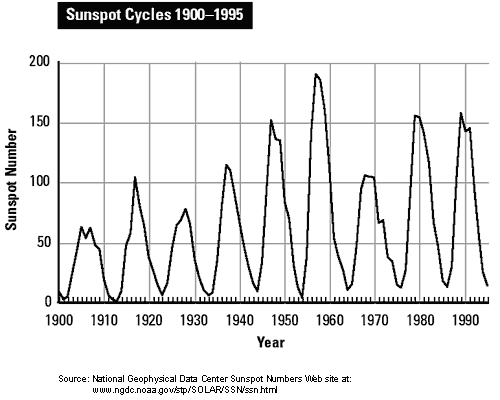
Sunspots are cooler areas on the Sun that appear as dark spots. These spots tend to occur in cycles that start at the solar minimum (when the fewest spots occur), reach their solar maximum (when the most spots occur), and reduce again in number until the cycle begins again. Can these spots and their cycles tell us anything? Do this activity to find out.
Procedure
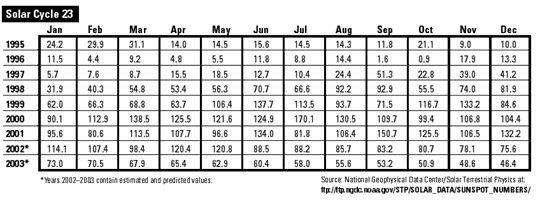
Observe the following graph of the sunspot cycles from 1900 to 1995. List any patterns that you notice. How is each cycle similar? How is each cycle different? Label the graph with an x for each solar maximum and an m for each solar minimum. From the graph, estimate the year when each cycle started and when it ended. Calculate the length of each cycle and the average length for the nine cycles shown. Graph the data from Solar Cycle 23 below on your sheets of graph paper.


Questions
Write your answers on a separate sheet of paper.
When did Solar Cycle 23 begin? Did Solar Cycle 23 reach its solar maximum? If so, when did this occur? Based on the average you calculated for the other solar cycles, when do you predict this cycle will end? Can you predict when the next solar maximum might occur? Explain your prediction.
|

