Where the Tornadoes Are 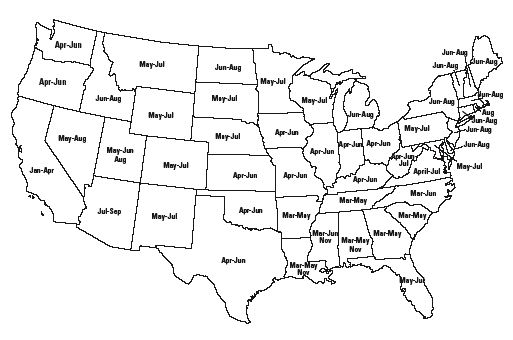
This graphic shows the months of peak tornado occurrence in the 48 contiguous states. The months shown are based on data collected from 1950-1991. 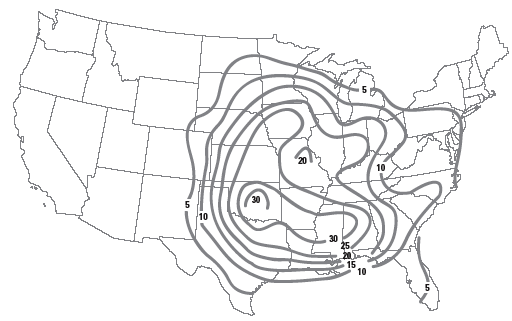
This graphic depicts the mean number of days per century with at least one F2 or greater tornado touching down in a grid (each grid has a spacing of 80 kilometers). Results are based on data collected from 1921-1955 that includes more than 10,000 tornadoes listed by date, damage classification, and location of touchdown by county. |