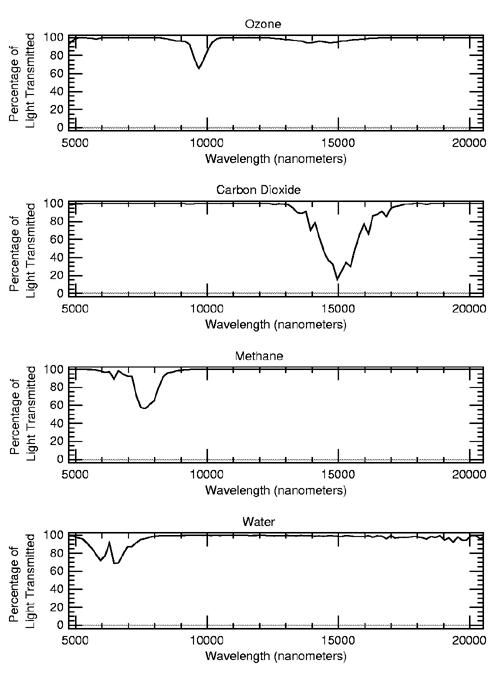
Planet Spectra The planet spectra data shown here represent the infrared portion of the electromagnetic spectrum, where planets re-emit the energy absorbed from their parent star. The dips in the curve result when gases in the planet's atmosphere absorb certain wavelengths of energy. Because every element and compound has a characteristic pattern of absorption, the location of these absorption bands allow scientists to identify the element or compound in the atmosphere that is absorbing the energy. Except for Archean Earth, these graphs represent real satellite data. The Archean Earth spectrum represents a scientific model of Earth's atmosphere based on what is known about this time in Earth's history and what is understood about modern planetary atmospheres. The major absorption bands on each planet's spectrum have been labeled with the compound(s) responsible for the absorption. 
What Is Brightness Temperature? Scientists often plot brightness temperature instead of intensity because the spectral features caused by atmospheric composition are more easily seen when plotted this way. Brightness temperature is the temperature an object must have to produce the observed intensity. |