Different
types of lava have different viscosities (viscosity is the resistance of a
fluid to flow). In this activity, you will use different liquids to investigate
viscosity and how viscosity affects the speed at which the liquid flows.
Gently swirl and observe the liquids in the three test tubes. Which seems to be
the thickest (most viscous)? Which seems to be the least thick (least viscous)?
On your "Data Sheet" handout, predict which liquid is the most viscous, which
is the least, and which is in between.
-

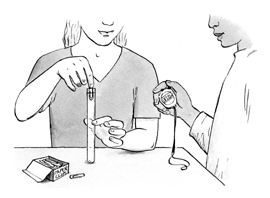
Drop your paper clip into the liquid and time how long it takes for it to
fall. Have one member of your group hold the paper clip at the surface of the
liquid and release the paper clip. When it is completely below the surface,
have another person start timing. The stopwatch should be stopped as soon as
the paper clip tip touches the tube bottom.
On your "Data Sheet" handout, record how long it takes for a paper clip to
fall through each liquid.
Do two more trials for each liquid. (You may leave the first paper clip in
the liquid.) Average your results.
Assign a value of 1 (least viscous) to 3 (most viscous) to the three
liquids. Record the values.
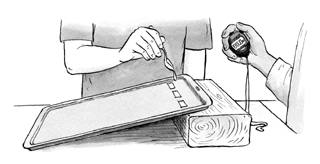
Make a ramp by balancing a cookie sheet on the edge of the wooden block. Use
your masking tape to create three starting lines at the 25-centimeter mark (the
bottom of the masking tape should be 25 centimeters from the end of the ramp).
Record this distance on the "Rate of Flow Results" table on your "Data Sheet"
handout.
Predict how the viscosity of each liquid will affect the speed with which
the liquid flows down the ramp. Which liquid will have the fastest speed down
the ramp? Which will have the slowest? Record your predictions on your "Data
Sheet" handout.
-

Pour one plastic teaspoonful
of one of the liquids just before the top of the masking tape and start timing
as soon as the liquid passes the bottom of the tape and touches the ramp
surface. Stop the timer when the liquid reaches the bottom of the ramp. Record
the results. Clean the ramp and repeat the test two more times, using a new
starting line each time. Average your results.
Calculate the flow rate by dividing the distance of the ramp by the average
time it took the liquid to cover that distance. Record the flow rate or speed
in your data table.
Repeat steps 7 and 8 for the other two liquids.
Display
your flow rate results for the three liquids in a bar graph. Label the
x-axis "Liquid" and the y-axis "Rate of Flow (cm/sec)".