The Great Inca Rebellion
|  |
Student Handout
|
Teeth: Cavities
Caries, better
known as cavities, is one of the most common diseases of the teeth. The
calcified tissue becomes demineralized, resulting in a cavity. In severe cases
the tooth's pulp is exposed and sometimes it becomes infected or
abscessed.
The factors
responsible for caries are not well understood but soft foods and
carbohydrate-rich diets have been implicated. Apparently foods that stick to
the teeth, particularly processed carbohydrates (like corn that has been ground
and cooked), encourage certain bacteria to flourish and produce acids that
break down the tooth. Tables 1a and 1b shows the number and percentages of
children, adolescents, and adults by the type of cavities they had.
Procedure
Review and graph the data. Analyze the data for what it reveals about the health
of each community. Use the information on this page and what you have
learned from the data to answer the questions listed.
Table 1a:
Frequency of Cavities in Children by Type*
|
Indian Knoll
|
Hardin Village
|
|
Type of Cavity
|
Children*
6–11 months
0
|
Children*
1–5 years
0
|
Children*
6–11 months
18
|
Children*
1–5 years
59
|
|
#C |
%C |
# N1 |
% N1 |
#C |
%C |
# N1 |
% N1 |
#C |
%C |
# N1 |
% N1 |
#C |
%C |
# N1 |
% N1 |
|
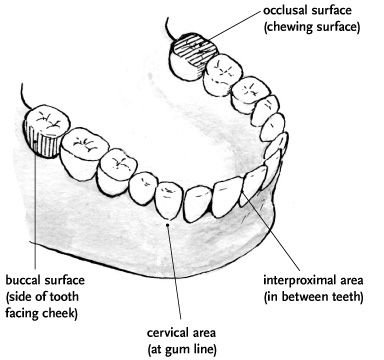
Occlussal
|
0 |
0 |
0 |
0
|
0 |
0 |
0 |
0
|
19 |
27.1 |
7 |
38.9
|
55 |
39.9 |
21 |
35.6
|
|
Interproximal
|
0 |
0 |
0 |
0
|
0 |
0 |
0 |
0
|
18 |
25.7 |
7 |
38.9
|
6 |
4.3 |
4 |
6.8
|
|
Cervical
|
0 |
0 |
0 |
0
|
0 |
0 |
0 |
0
|
16 |
22.9 |
5 |
27.8
|
10 |
7.2 |
5 |
8.5
|
|
Buccal
|
0 |
0 |
0 |
0
|
0 |
0 |
0 |
0
|
17 |
24.3 |
7 |
38.9
|
67 |
48.6 |
14 |
23.7
|
|
Total
#C
|
0
|
0
|
70
|
138
|
Table 1b: Frequency of Cavities
in Adults by Type
|
Indian Knoll
|
|
Type of Cavity
|
Adult Males
89
|
Adult Females
68
|
Adolescents*
16
|
|
#C |
%C |
# N1 |
% N1 |
#C |
%C |
# N1 |
% N1 |
#C |
%C |
# N1 |
% N1 |
|
Occlussal
|
26 |
40.0 |
9 |
10.1
|
15 |
24.2 |
10 |
14.7
|
0 |
0 |
0 |
0
|
|
Interproximal
|
10 |
15.3 |
8 |
9.0
|
16 |
25.8 |
8 |
11.8
|
0 |
0 |
0 |
0
|
|
Cervical
|
21 |
32.3 |
10 |
11.2
|
23 |
37.1 |
9 |
13.2
|
1 |
12.5 |
1 |
6.3
|
|
Buccal
|
8 |
12.4 |
6 |
6.7
|
8 |
12.9 |
4 |
5.9
|
7 |
87.5 |
4 |
25.0
|
|
Total
#C
|
65
|
62
|
8
|
|
Hardin Village
|
|
Type of Cavity
|
Adult Males
55
|
Adult Females
57
|
Adolescents*
23
|
|
#C |
%C |
# N1 |
% N1 |
#C |
%C |
# N1 |
% N1 |
#C |
%C |
# N1 |
% N1 |
|
Occlussal
|
92 |
24.8 |
36 |
65.5
|
125 |
25.8 |
30 |
52.6
|
53 |
61.6 |
13 |
56.5
|
|
Interproximal
|
64 |
17.3 |
28 |
50.9
|
112 |
23.1 |
41 |
71.9
|
9 |
10.5 |
5 |
21.7
|
|
Cervical
|
153 |
41.2 |
31 |
56.4
|
135 |
27.8 |
38 |
66.6
|
2 |
2.3 |
2 |
8.7
|
|
Buccal
|
62 |
16.7 |
22 |
40.0
|
113 |
23.3 |
33 |
57.9
|
22 |
25.6 |
7 |
30.4
|
|
Total
#C
|
371
|
485
|
86
|
* Sexes are combined.
Key
#C represents the occurrence of each type of cavity
out of the total number of cavities for each group. For example, of all the
cavities that occurred in Hardin Village adult males (371), 92 of those
cavities were occlusal.
%C represents the percentage of each type of cavity in
relation to the total number of cavities for each group. For example, of all
the cavities that occurred in Hardin Village adult males (371), 24.8 percent of
them (92) were occlusal.
#N1 represents the number of individuals
with each type of cavity. For example, of all the Hardin Village adult males
who had cavities (55), 36 individuals had occlusal cavities.
%N1 represents the percentage of
individuals who had each type of cavity in relation to all individuals in that
group. For example, of all the Hardin Village adult males who had cavities
(55), 65.5 percent of them (36 individuals) had occlusal cavities.
Questions
Write your
answers on a separate sheet of paper.
What do you
notice about the distribution of cavities in children? What do you notice about the frequency of total
cavities between the two groups? What
conclusions could you draw from this data and the information you have been
given? Write down any other observations you have about this
data set.
|