Marathon Challenge
|  |
Student Handout
|
Plotting Your Results
As
a class, you will determine the range of heartbeats per minute to fill in on
the y-axis of your
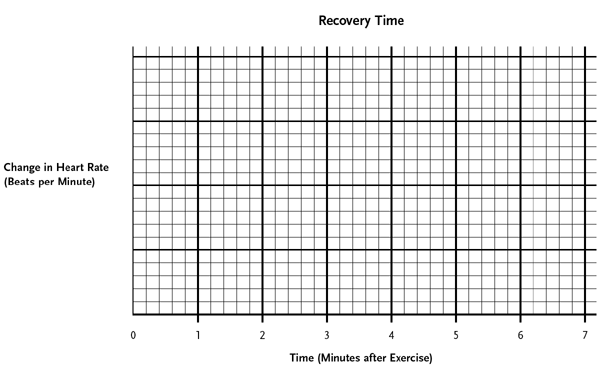
data table. When that axis has been filled in, plot your resting pulse rate on
the graph below with a dotted line. After you have exercised and calculated
your pulse rate per minute for the seven-minute period, plot your results on
the graph below. Then draw a line through the data points.

Questions
Write your
answers on a separate piece of paper.
What are some of the factors that influence resting pulse rate? Why might an
athlete have a lower pulse rate than a person who does not exercise regularly? In the "Recovery Time" graph, describe the changes that occurred to
your heartbeat in minutes 1–7. Use specific numbers from the data table
in your response. If you compared the
graph of an extremely fit athlete with the graph of a sedentary 50-year-old
individual, would you expect them to be alike or different? Explain your
reasoning. What effect could a longer pulse recovery period have on a person's
ability to perform certain activities? What effect could a shorter pulse
recovery period have? What might a person do to improve his or her recovery period?
|
