
|
|
NOVA scienceNOW: Hurricanes
|
|
|
|
Viewing Ideas
|
|
|
Before Watching
-
Called typhoons in the Western Pacific or tropical cyclones
worldwide, hurricanes are destructive natural events that cause
major loss of life and property. But what are they and how do
they form? Help students learn more about hurricanes by making a
chart on the board (or a handout) that includes basic
information about them. Discuss the following with students:
- What is a hurricane?
- What causes it to form?
- What are the main parts of a hurricane?
- What stages do they go through?
- What causes hurricanes to increase in intensity?
- How do scientists classify hurricanes?
- How long do they last?
- How large an area can a hurricane affect?
- How many usually occur in a ten-year period?
- Describe any beneficial effects of hurricanes.
Use a world map to explore where hurricanes form and where they
travel. (See
Links & Books for more information
about hurricanes.)
-
Have students research and report on the three major weather
events that have happened in their local area. What happened?
How long did each event last? What was the impact of each
weather event? (Note: They should include a written narrative of
any personal experiences they, family, or friends recall.) How
does it compare to harsh weather they have read about?
-
Some population centers are susceptible to area-wide hazards
that may require evacuation. Hurricanes are just one example of
weather-related hazards. Other natural hazards include fire,
flooding, earthquakes, and mud slides. Ask students if they know
what to do in the case of a disaster. Have them research their
local civil defense plan (which outlines a coordinated response
to natural and other types of disasters). What hazards have
people prepared for? How will citizens get instructions? What
are citizens supposed to do? Have students find out what their
school's emergency plan is. You might also have them create
personal weather emergency plans.
After Watching
-
Florida is in the pathway of many hurricanes. Students have
probably seen television news stories showing people preparing
their property for the worst. Often before the arrival of these
storms, people are asked to leave their homes voluntarily. Many
leave, but many others do not. In certain cases, some of the
people who stay lose their lives. Tell students that they are
residents in a city that is 14 feet below sea level and a
hurricane is heading toward the area. What might be some reasons
they would leave or stay? (Reasons for not leaving might include
not wanting to leave their home, believing that they have taken
enough safety precautions such as boarding up their home, or
thinking the storm will not be too severe. Reasons they leave
usually have to do with the desire to ensure their own and their
family's safety.)
-
Settlers built New Orleans on a swamp between the Mississippi
River and Lake Pontchartrain. They built a levee around the
swamp and then pumped out the water. Los Angeles, on the
southern California coast, is a city without a local water
supply. Amsterdam, capital of The Netherlands, was built on
dikes designed to keep out the North Sea. To say the least,
these cities were difficult to build. What purpose might have
compelled early settlers to defy such obstacles? Have students
research these cities to see why each was established at its
location. Is there a common theme among these reasons? (All were
located on water, which is an important trade route. Other
factors were Amsterdam's excellent farmland and New Orleans'
geopolitical interest to France as the location from which they
could control the Mississippi and the continent's interior,
thereby denying the English access to this region.)
-
Explore with students some of the topographical features of New
Orleans to help them understand the dangers the city faces if a
strong hurricane hits. How many square miles is the city? How
many airports does the city have? How many roads leave the city?
How many square miles of wetlands protect New Orleans? How has
the size of the wetlands changed over the last four decades? How
is the size of the wetlands projected to change over the next 10
years? What are the implications for the city? (See
Links & Books for more resources
and information.)
-
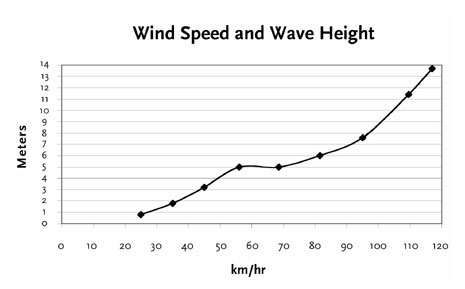
It's intuitive that there is a relationship between wind speed
and wave height—strong winds produce big waves. But is it
a simple linear relationship or is it more complex? Have
students calculate the center value (mid-point for each range of
numbers) in kilometers per hour for the wind speeds given in the
table below. (The table below, originally in knots, has been
converted into kilometers and miles per hour, so that students
can see how these speeds compare. See
Links & Books for information on
the Beaufort Wind Scale.) Then, have students make a graph by
plotting the center values for wind speed (x-axis) against the
wave height (y-axis). (See the sample graph below.) Is there a
pattern? What relationship is there between wind speed and wave
height?
Beaufort Wind Scale
|
Wind Speed
|
Wave Height
|
Appearance of Wind Effects
|
|
miles/hour
|
kilometers/hour
|
meters
|
on water
|
<1 |
<1 |
<0.3 |
Mirror-like surface |
1-3 |
1-5 |
<0.3 |
Scaly ripples |
4-7 |
6-11 |
<0.3 |
Small wavelets |
8-12 |
13-19 |
<0.3 |
Large wavelets |
13-18 |
21-29 |
0.3-1.2 |
Small waves, numerous whitecaps
|
19-24 |
31-39 |
1.2-2.4 |
Moderate waves, many whitecaps
|
25-31 |
40-50 |
2.4-3.9 |
Larger waves, many whitecaps
|
32-38 |
51-61 |
3.9-6.0 |
White foam streaks off breaking waves, more 3.9 meter than
6.0 meter waves
|
39-46 |
63-74 |
3.9-6.0 |
Moderately high waves of greater length, approximately
equal numbers of 3.9 and 6.0 meter waves
|
47-54 |
76-87 |
6.0 |
High waves, spray may reduce visibility
|
55-63 |
89-101 |
6.0-9.1 |
Very high waves with overhanging crests, visibility
reduced
|
|
64-73 |
102-117 |
9.1-13.7 |
Exceptionally high waves, foam patches cover sea, low
visibility
|
|
74+ |
>119 |
>13.7 |
Exceptionally high waves. Air filled with foam, white sea,
visibility greatly reduced
|
Source: Based on the Beaufort Wind Scale, National Oceanic and
Atmospheric Administration, www.noaa.gov
Now have students explore possible hurricane damage caused by
three different wave heights (2 meters, 4 meters, and 6 meters)
and their associated wind speeds. They can begin their research
with the Beaufort Wind Scale (estimates wind strengths based on
observable effects) or the Saffir-Simpson Hurricane Scale (rates
hurricane intensity). (See Links & Books for information on
both scales.)

Web Sites
Hurricane Features
www.comet.ucar.edu/nsflab/web/hurricane/311.htm
Describes hurricanes and how and where they form, including
information on winds, storm surges, and damages.
The Creeping Storm
www.pubs.asce.org/ceonline/ceonline03/0603feat.html
Provides a civil engineering article with detailed descriptions
about the location of New Orleans and the probable consequences of a
hurricane.
Consequences of Landscape Deterioration
www.coast2050.gov/reports/Chap6.pdf
Reports on the consequences of landscape deterioration on New
Orleans and all of Louisiana.
National Weather Service Chicago
www.crh.noaa.gov/lot/webpage/beaufort/
Provides a detailed description of the Beaufort Wind Scale.
Land Beaufort Scale
www.ncdc.noaa.gov/oa/climate/conversion/beaufortland.html
Describes what happens to land conditions as wind force increases.
Knots to Miles Per Hour Conversion Chart
www.ncdc.noaa.gov/oa/climate/conversion/windchart.html
Shows math conversions for knots to mph.
Science and Technology Focus, Ocean in Motion: Waves-Beaufort Wind
Scale
www.onr.navy.mil/focus/ocean/motion/waves4.htm
Includes chart that tells wave height and sea conditions as wind
strength increases.
Books
Challoner, Jack. Eyewitness: Hurricane and Tornado. New York:
Dorling Kindersley, 2003.
Discusses how and where hurricanes and tornados form, along with
models, illustrations, and full-color photographs.
Allaby, Michael, and Jackson, Stephanie.
How the Weather Works. New York: Readers Digest Association,
1995
Focuses on weather experiments, record keeping, and forecasting
techniques.
Lynott, Bob. How Weather Works and Why. Portland, OR: Gadfly
Press, 1994.
Introduces how weather works and explains extreme weather phenomena.
|
|
