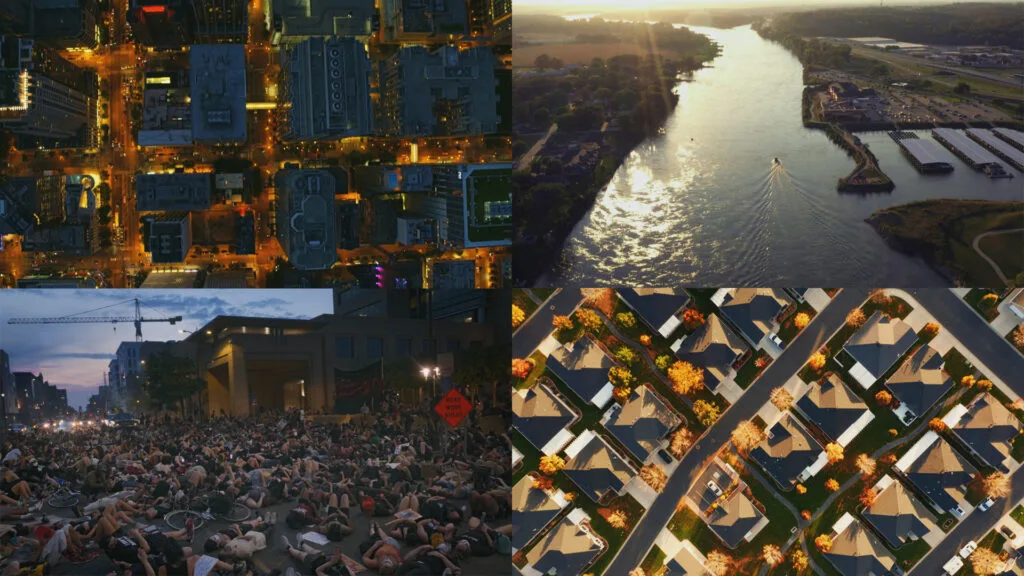
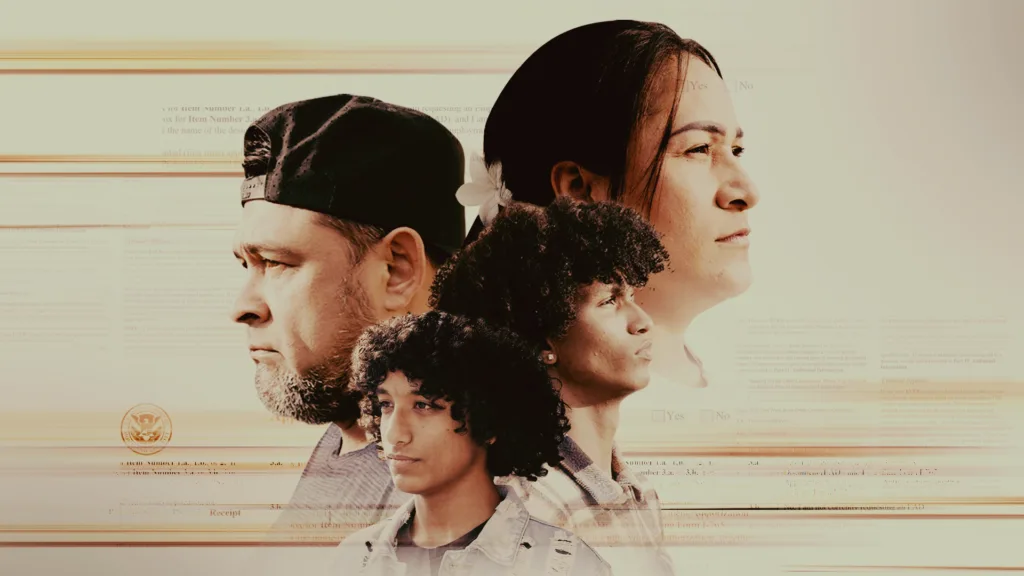
Americans have grappled with a tumultuous 2020, from the coronavirus pandemic to George Floyd’s killing and protests against police brutality to one of the most divisive presidential elections in U.S. history.
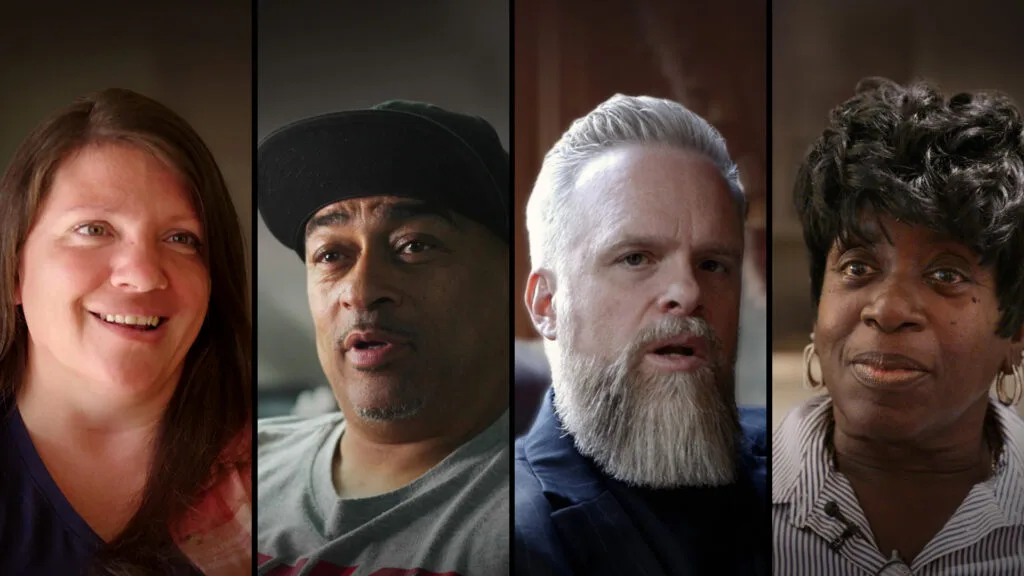
To understand what we’ve faced and where we’re headed, FRONTLINE’s post-election special, American Voices: A Nation in Turmoil, followed a handful of people from diverse backgrounds: rural areas, small towns and big cities, across racial and economic divides.
But each of these people speaks for themselves only. To help provide context, we’ve looked to numbers to lend some broad insight into their communities.
The demographics and population information below comes from the U.S. Census Bureau, reflecting data from 2010 to 2019 (population estimates, 2019; people per square mile, 2010; median household income and foreign-born percentage of the population, both 2014 to 2018), and using the bureau’s definitions, race designations and poverty margins. Voter and COVID-19 data comes from state and county sources and was updated November 17. All COVID-19 information is county-level.
SIOUX CITY, IOWA
Sioux City sits on the Missouri River, near Iowa’s northern border with Nebraska. The city was hit hard by COVID-19, Sioux City’s mayor, Bob Scott, told FRONTLINE. “Obviously the most pressing problem in Sioux City is the pandemic,” Scott wrote in an email. “We have had numbers that have steadily increased over the summer and fall, with no relief on the horizon. It [has] affected many of our businesses in a negative way. Our medical facilities and their [staff] are being taxed like never before.”
Population estimate: 82,651
• White: 83.7%
• Black: 4.3%
• Native American: 2.1%
• Hispanic: 19.1%
• Asian: 3.5%
• Two or more races: 3.2%
• Foreign-born: 10%
People per square mile: 1,441.7
Median household income: $53,281
Percentage living in poverty: 14.5%
Registered voter turnout in Woodbury County: 69%
Votes for Trump in the county: 57%, compared to 53.2% statewide
Votes for Biden in the county: 41%, compared to 45% statewide
Total COVID cases in the county: 9,334
COVID cases per 1,000 in the county: 90.53
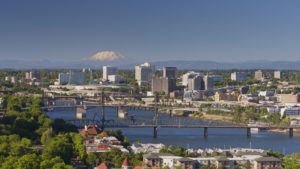
PORTLAND, OREGON
Portland in 2020 became a focal point of the nationwide demonstrations against police brutality, reaching 100 consecutive days of protest in September. At the same time, COVID-19 has pummeled Multnomah County, where Portland is located, with more cases than anywhere else in the state, according to the Oregon Health Authority.
“The pandemic and protests for racial justice dominated Portland’s headlines and the city’s work,” Portland’s mayor, Ted Wheeler, wrote in an email to FRONTLINE. “And, it’s still an amazing place. We will come through this stronger and more just than before.”
Population estimate: 654,741
• White: 77.1%
• Black: 5.8%
• Native American: 0.7%
• Hispanic: 9.7%
• Asian: 8.1%
• Two or more races: 5.5%
• Foreign-born: 13.9%
People per square mile: 4,375.2
Median household income: $65,740
Percentage living in poverty: 14.9%
Registered voter turnout in Multnomah County: 82.24%
Votes for Trump in the county: 17.89%, compared to 40.34% statewide
Votes for Biden in the county: 79.23%, compared to 56.49% statewide
Total COVID cases in the county: 13,138
COVID cases per 1,000 in the county: 16.16
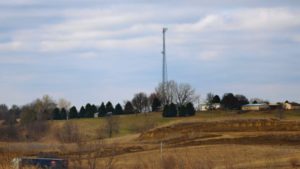
COOL, CALIFORNIA
Tiny Cool accounts for only about 2% of El Dorado County’s total population. But unincorporated communities — or regions not governed by a local municipality, such as Cool — make up 78% of the county’s 192,843 residents. Census data for Cool is not available.
Population estimate, Cool: 4,100
(Racial breakdown below represents all of El Dorado County)
• White: 88.6%
• Black: 1%
• Native American: 1.3%
• Hispanic: 13.2%
• Asian: 4.8%
• Two or more races: 3.9%
• Foreign-born: 9.6%
People per square mile in El Dorado County: 106
Median household income in the county: $80,582
Percentage living in poverty in the county: 8.1%
Registered voter turnout in the county: 86.86%
Votes for Trump in the county: 52.33%, compared to 34.1% statewide
Votes for Biden in the county: 43.72%, compared to 63.8% statewide
Total COVID cases in the county: 1,694
COVID cases per 1,000 in the county: 8.78
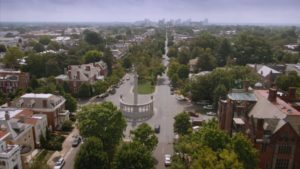
RICHMOND, VIRGINIA
The effects of COVID-19 have pervaded every aspect of life in Richmond, the city’s mayor, Levar Stoney, told FRONTLINE. “All of these inequities have been illuminated, whether in housing, policing, public safety, education.” Widespread protests in the wake of George Floyd’s death also brought a new sense of urgency, Stoney said. In August, he introduced new legislation banning firearms at public events, and the council approved the measure in September. Richmond is one of Virginia’s independent cities and is not part of a county.
Population estimate: 230,436
• White: 45.4%
• Black: 47.8%
• Hispanic: 6.7%
• Asian: 2.1%
• Native American: 0.4%
• Two or more races: 3.3%
• Foreign-born: 6.7%
People per square mile: 3,414.7
Median household income: $45,117
Percentage living in poverty: 24.5%
Registered voter turnout in Richmond: unavailable at press time
Votes for Trump in Richmond: 14.95%, compared to 44% statewide
Votes for Bidenin Richmond: 82.91%, compared to 54.1% statewide
Total COVID cases in Richmond: 6,055
COVID cases per 1,000 in Richmond: 26.28
AMERICAN FORK, UTAH
American Fork sits about 30 miles south of Salt Lake City, in Utah County. Mayor Brad Frost told FRONTLINE that his greatest concern in 2020 has been the physical and mental health of his community during the pandemic: Utah County has reported the second-highest number of infections of any county in the state. “I have just tried to govern in a way that has common-sense approaches but without harming the economy,” Frost said. “This is a very polarizing situation.”
Population estimate: 33,161
• White: 92.9%
• Black: 0.4%
• Native American: 0.5%
• Hispanic: 8.9%
• Asian: 0.6%
• Two or more races: 2.9%
• Foreign-born (2014-2018): 4.7%
People per square mile: 2,853.7
Median household income: $74,192
Percentage living in poverty: 7.6%
Registered voter turnout in Utah County: 89.18%
Votes for Trump in the county: 66.69%, compared to 58.15% statewide
Votes for Bidenin the county: 26.30%, compared to 37.67% statewide
Total COVID cases in the county: 40,623
COVID cases per 1,000 in the county: 63.85
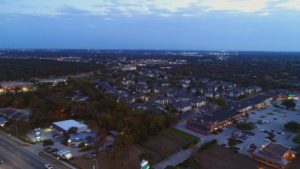
CEDAR PARK, TEXAS
The population of Cedar Park, a northern suburb of Austin, has increased more than 40% in the past decade, and more than 90% of residents are younger than 65. Mayor Corbin Van Arsdale told FRONTLINE many young people have moved to Cedar Park to work in the emerging tech industry, and Apple plans to open a new campus in Austin in 2022.
President-elect Joe Biden clinched Williamson County, in which Cedar Park is located, by a narrow margin. Van Arsdale said the election exacerbated political disagreements about how to navigate the pandemic and the economy in his “purple community.”
Population estimate: 79,462
• White: 80.1%
• Black: 2.8%
• Native American: 0.4%
• Hispanic: 18.8%
• Asian: 9.7%
• Two or more races: 4.3%
• Foreign-born: 13.6%
People per square mile: 2,141.9
Median household income: $101,845
Percentage living in poverty: 4.4%
Registered voter turnout in Williamson County: 75.64%
Votes for Trumpin the county: 48.15%, compared to 52.17% statewide
Votes for Bidenin the county: 49.56%, compared to 46.4% statewide
Total COVID casesin the county: 11,016
COVID cases per 1,000 in the county: 18.65
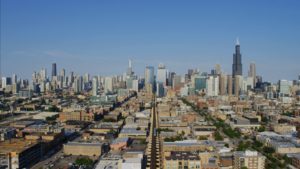
CHICAGO, ILLINOIS
The third largest city in the U.S., Chicago has averaged 2,351 new COVID-19 cases per day in the past week. “The events of this year, particularly the COVID-19 pandemic and the murder of George Floyd, have served as critical inflection points for Chicago, as well as the nation — providing a wake-up call that urges us finally to acknowledge and address the socioeconomic fault lines of our city,” Mayor Lori E. Lightfoot told FRONTLINE.
Population estimate: 2,693,976
• White: 49.4%
• Black: 30.1%
• Hispanic: 29%
• Asian: 6.4%
• Native American: 0.3%
• Two or more races: 2.7%
• Foreign-born: 20.6%
People per square mile: 11,841.1
Median household income: $55,198
Percentage living in poverty: 19.5%
Registered voter turnout in Cook County: 68.87%
Votes for Trumpin the county: 32.35%, compared to 40.7% statewide
Votes for Bidenin the county: 66.08%, compared to 57.4% statewide
Total COVID cases in the county: 121,621
COVID cases per 1,000 in the county: 23.61
MINNEAPOLIS, MINNESOTA
Minneapolis drew national attention this year when city resident George Floyd died on May 25 after police officer Derek Chauvin was caught on video kneeling on Floyd’s neck while Floyd was handcuffed. Protesters marched against police brutality for months, with police arresting hundreds. In the coming weeks, the Minneapolis City Council will hold hearings to determine the city’s 2021 budget, including funding for the police department.
“Moving forward Minneapolis will have the opportunity — and obligation — to reconcile our shared aspirations for a better future with a painful history,” Mayor Jacob Frey wrote in an email to FRONTLINE.
Population estimate: 429,606
• White: 63.8%
• Black: 19.4%
• Hispanic: 9.6%
• Asian: 6.1%
• Native American: 1.4%
• Two or more races: 4.6%
• Foreign-born: 15.7%
People per square mile: 7,088.3
Median household income: $58,993
Percentage living in poverty: 19.9%Registered voter turnout in Hennepin County: 90.48%
Votes for Trump in the county: 27.25%, compared to 45.29% statewide
Votes for Biden in the county: 70.46%, compared to 52.39% statewide
Total COVID cases in the county: 52,181
COVID cases per 1,000 in the county: 41.22
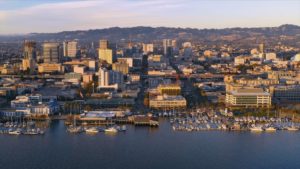
OAKLAND, CALIFORNIA
The racially diverse city of Oakland sits in Alameda County, which historically has supported Democrats for president — and 2020 was no different. Biden voters cast more than four times the number of ballots as Trump voters in the general election. Like other cities across the country, Oakland erupted in the wake of George Floyd’s death, in May, with protests continuing this fall, in the wake of a grand jury decision in the Breonna Taylor case.
Population estimate: 433,031
• White: 36.1%
• Black: 23.6%
• Native American: 0.9%
• Hispanic: 26.9%
• Asian: 15.7%
• Two or more races: 6.8%
• Foreign-born: 27.6%
People per square mile: 7,004
Median household income: $68,442
Percentage living in poverty: 17.6%
Registered voter turnout in Alameda County: 81.08%
Votes for Trump in the county: 17.7%, compared to 34.2% statewide
Votes for Bidenin the county: 80.2%, compared to 63.7% statewide
Total COVID casesin the county: 26,063
COVID cases per 1,000 in the county: 15.59
When the pandemic hit, Dr. Blair Woodbury picked up the phone. He called his old friend, filmmaker Mike Shum, and urged him to get out and start recording the first draft of history
When the pandemic hit, Dr. Blair Woodbury picked up the phone. He called his old friend, filmmaker Mike Shum, and urged him to get out and start recording the first draft of history