Map: U.S. Nuclear Power Plants
January 17, 2012
Share
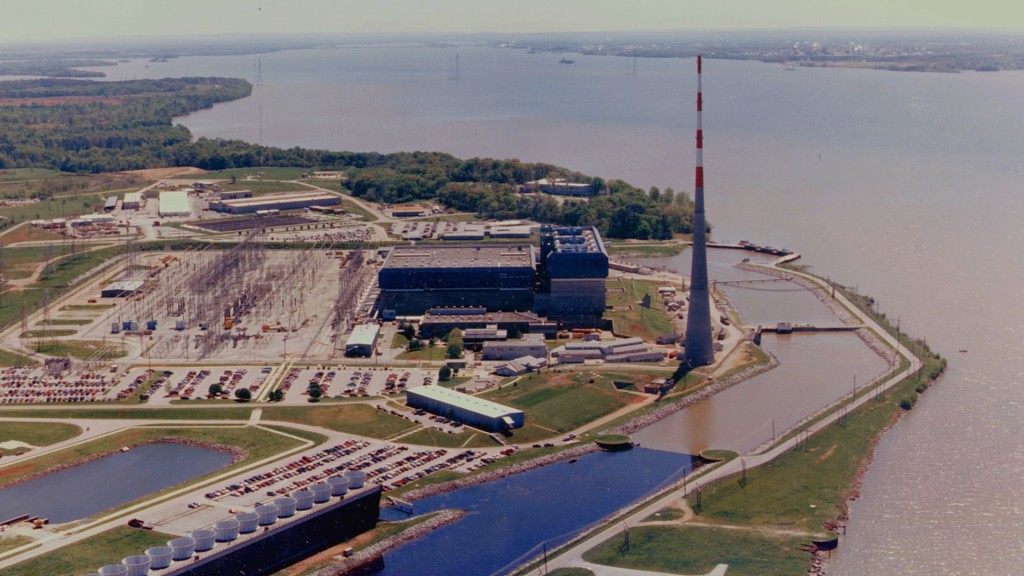
While nuclear power is generally considered a safe, environmentally friendly form of electricity generation — there hasn’t been a major incident in the U.S. since the core meltdown at Three Mile Island in 1979 — a number of smaller incidents and accidents at several plants have caused critics to take a second look.
The below map shows all 104 U.S. nuclear reactors and highlights some of the findings from the Union of Concerned Scientists, a branch of which operates as a nuclear watchdog. Click on an icon to learn more about:
+ “Near misses” — The UCS spotlighted 14 incidents in 2010 that “raised the risk of damage to the reactor core — and thus to the safety of workers and the public,” as well as three examples of exceptional preventative responses by the Nuclear Regulatory Commission.
+ Fire Protection — As ProPublica and iWatch have reported, fire is among the most dangerous risks to nuclear facilities. The NRC established regulations in 1980 after a dangerous fire at the Browns Ferry plant in Alabama, and the guidelines were relaxed in 2004 to allow plants to create individualized fire protection plans. But even today, 47 U.S. reactors — including Browns Ferry — don’t meet the NRC’s fire protection regulations.
+ Seismic risk — Fukushima showed the world the danger of locating nuclear plants in or near earthquake zones. According to the NRC, 27 reactors don’t meet its seismic risk guidelines adopted in the mid-90s.
+ Age — About half of the nuclear plants in the U.S. have been in operation for 30 years or more; none are younger than 10 years. “As plants get older, the chance of failure goes up,” UCS’s David Lochbaum told FRONTLINE, depending on how well parts are maintained and replaced.


[Sources: Nuclear Regulator Commission, Union of Concerned Scientists]
Dig Deeper
Want additional maps for information not included in ours? Start with our look at how much electricity each state generates from nuclear, using 2010 statistics from the Nuclear Energy Institute. For data on population density near nuclear facilities in the U.S., check out this nifty map from Zeit Online. And for more on earthquakes, GOOD highlights some maps that lay out past earthquakes in the U.S. and their proximity to nuclear power plants.
Related Documentaries
Latest Documentaries


Related Stories
Nuclear Aftershocks
Related Stories
Nuclear Aftershocks
Explore
Policies
Teacher Center
![]()
Jon and Jo Ann Hagler on behalf of the Jon L. Hagler Foundation
Corey David Sauer
Koo and Patricia Yuen
FRONTLINE is a registered trademark of WGBH Educational Foundation. Web Site Copyright ©1995-2025 WGBH Educational Foundation. PBS is a 501(c)(3) not-for-profit organization.
Funding for FRONTLINE is provided through the support of PBS viewers and by the Corporation for Public Broadcasting, with major support from Ford Foundation, and The Fialkow Family Foundation, as part of the Plum Bush Foundation. Additional funding is provided the Abrams Foundation, Park Foundation, John D. and Catherine T. MacArthur Foundation, Heising-Simons Foundation, and the FRONTLINE Trust, with major support from Jon and Jo Ann Hagler on behalf of the Jon L. Hagler Foundation, and Corey David Sauer, and additional support from Koo and Patricia Yuen. FRONTLINE is a registered trademark of WGBH Educational Foundation. Web Site Copyright ©1995-2025 WGBH Educational Foundation. PBS is a 501(c)(3) not-for-profit organization.