|

|

|
Advance Warning by Mark Hoover 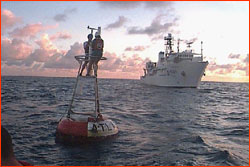 In May of 1997, in a game of high stakes, a classic match-up
between computer power and human intuition was about to
unthrone a world champion and reveal the awesome power of
visualization in solving complex "what if?" questions. None of
this, however, had anything to do with Gary Kasparov or
playing chess.
In May of 1997, in a game of high stakes, a classic match-up
between computer power and human intuition was about to
unthrone a world champion and reveal the awesome power of
visualization in solving complex "what if?" questions. None of
this, however, had anything to do with Gary Kasparov or
playing chess.In that month, a leading oceanography journal published an article about what the champion El Niño computer model foresaw for the coming year. Unequivocally, the model was forecasting a cold ocean—the opposite of an El Niño—throughout the remainder of 1997. For more than a decade, this model had outperformed all others in predicting El Niños to come, as well as in predicting El Niños of the past, if historical data was fed into it. It was the best of a dozen or more competitors, and now it was just plain wrong: in May 1997 the fastest-rising and strongest El Niño ever recorded had already been brewing for months, and was about to surge across the Pacific Ocean to wreak havoc in the east. How could the best model have been so...bad? Meanwhile, about five months earlier at the Pacific Marine Environmental Laboratory in Seattle, researchers had noted the first of a series of pulses in winds above the equatorial Pacific ocean, pulses that sometimes precede the onset of an El Niño, and the change immediately caught their attention. For the first time ever, they were literally seeing—in real time—a picture of what was happening on the surface of the ocean and in the air above it, across the entire basin of the tropical Pacific. They were using an ingenious new instrument that could tell you in a glance the current state of the engine of most of Earth's weather. What they saw was vindicating the visionaries who had worked 15 years to design and build it. Barely finished two years earlier, this instrument was letting scientists watch the birth of the century's most powerful El Niño—as it happened.
Like an insect's compound eye, this instrument works by combining the input from a myriad of sensors into a unified picture. These sensors are attached to buoys moored on a grid that stretches across thousands of miles from South America to Australia, carving the entire region between the Tropic of Cancer and the Tropic of Capricorn into a checkerboard. In fact, the picture you see when you use the array is a lot like a checkerboard, too, where the current state of the ocean and air are represented by coloring the squares to match the information the sensors are relaying, via satellite, back to the lab. This is a checkerboard that pulsates in lockstep with the ocean and atmosphere itself—a checkerboard that moves. And now, for the first time since it had been completed, that checkerboard was moving in ways that suggested the onset of a powerful El Niño. Scientists by nature tend to be either measurement oriented, or theory oriented—observers or thinkers. Computer models are the products of theory; they try to calculate the future after being set up, or "initialized," with a static snapshot of the present. You load them with the best data you can get and then you push the button. 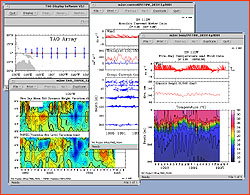 The Array uses plenty of computers, too, but not in quite the
same way. The Array's computers inhale a flood of measurements
taken minutes before out in the ocean, filter and massage
them, and use them to paint a canvas of present conditions.
The computers also let you play a time series, or animation of
pictures taken previously, like they do on the weather
forecast on the evening news. These animations let you sense a
trend or a pattern without sifting through reams of numbers.
And if El Niño is anything, it is first a pattern, a
rhythm in the dynamics between the sea and the air. Anything
that lets you concentrate on the patterns in El Niño
proves to be very useful indeed.
The Array uses plenty of computers, too, but not in quite the
same way. The Array's computers inhale a flood of measurements
taken minutes before out in the ocean, filter and massage
them, and use them to paint a canvas of present conditions.
The computers also let you play a time series, or animation of
pictures taken previously, like they do on the weather
forecast on the evening news. These animations let you sense a
trend or a pattern without sifting through reams of numbers.
And if El Niño is anything, it is first a pattern, a
rhythm in the dynamics between the sea and the air. Anything
that lets you concentrate on the patterns in El Niño
proves to be very useful indeed.In short, the Array gave the measurement crowd a sudden leg up on their more abstract colleagues. Although computer models have been and will remain a fundamental tool of climate and weather science, when it came to El Niño, it suddenly seemed a little circuitous to try to synthesize the future. Who needed a model when you could simply fire up your personal computer and see for yourself? Mike McPhaden, a measurement man, was one of these scientists, and around Christmas of 1996, as he looked at the checkerboard on his screen, he could see what was coming. He decided to trust his eyes and forget the model. As it became apparent over the next few months that a major El Niño was underway, Mike would sometimes feel amazement...but never surprise. Compare 1997 with 1982 if you want to see the difference the Array makes. 1982 was also an extreme El Niño year, and a year in which the detection systems that existed at that time failed for a variety of reasons. Ironically, the realization that a huge El Niño event was underway came at the precise moment an international convocation of climate scientists was meeting in Princeton, NJ to discuss El Niño detection. Although everyone seemed to agree that more detection instruments were needed, some felt that between traditional land-and sea-based measurements, and images gotten from the new TIROS satellites, at least a basic system was in place. Recent advances in El Niño theory, particularly by Klaus Wyrtki in the mid-70s, had made the idea of prediction suddenly much more credible, and some of the world's fastest supercomputers were in the hands of weather scientists to run the new prediction models. Further, two NOAA meteorologists, Rassmusson and Carpenter, had just published a major paper on the so-called "Canonical El Niño," a detailed composite summary of three decades worth of Niños from the 1950s, 60s, and 70s. By showing at every phase of development what the ideal El Niño looked like, this study could serve as a reference work to compare new events against...kind of like a bird-watcher's manual for anyone heading out into the field with binoculars, hoping to spot a crested warbler. You could simply look it up. So, in the autumn of 1982, no one in the world was aware of the impending El Niño and the destruction it would eventually bring. No one was making any preparations. Sure, some data retrieved from "ships of opportunity"—ships that took a few measurements as a courtesy to scientists as they plied their trade in the Pacific—were showing some strong temperature readings. A couple of reports from islands in the Pacific had filtered in, stuff like "lagoon temperature well above normal today," and so on. But these were so spotty that it was easy to dismiss the elevated readings as "outliers," or bad numbers that should be disregarded. After all, measurements taken by the new satellites weren't showing anything except normal conditions, definitely not the five or six degree (Celsius) anomalies the ships had shown. And according to the new Canonical El Niño reference, none of the other expected signals were showing up. The models running on the computers were silent, as well. By co-incidence, however, the Mexican volcano El Chichon had recently erupted, and it had pumped millions of tons of sulfuric acid aerosols into the stratosphere, highly reflective droplets that acted like a smoke screen to partially block the vision of the TIROS satellites. The effect was to lower the apparent sea surface temperatures measured by the satellites by about five or six degrees, neatly masking the growing El Niño. No wonder the random ship data looked weird compared to the neat, complete satellite data sets. Further, the El Niño of 1982 developed in ways utterly unlike the Niños of the previous three decades, surging and pulsing with unprecedented swiftness, and on uncharacteristic time scales. In fact, since 1982, no El Niño has followed the Rassmusson-Carpenter average very well, which has nothing to do with the quality of Rassmusson's and Carpenter's work, and a lot to do with the shape-shifting nature of the ocean-atmosphere dynamics that underlie El Niño, and possible long-term changes in the cycles upon which they are based. But in 1982, everyone was thinking the same way: unless it walked like a duck and quacked like a duck, it probably wasn't a duck. And no one heard anything in the ocean that sounded like the quack of El Niño. Continue: Modelling the interaction of the ocean and the atmosphere Photos/Images: (2-4) NOAA; (5) NOAA/ETL in Boulder. Anatomy of El Niño | Chasing El Niño | El Niño's Reach Dispatches | Resources | Mail | Site Map | El Niño Home Editor's Picks | Previous Sites | Join Us/E-mail | TV/Web Schedule About NOVA | Teachers | Site Map | Shop | Jobs | Search | To print PBS Online | NOVA Online | WGBH © | Updated November 2000 |