How the Stock Market & U.S. Household Income Diverged After the 2008 Crash
July 13, 2021
Share
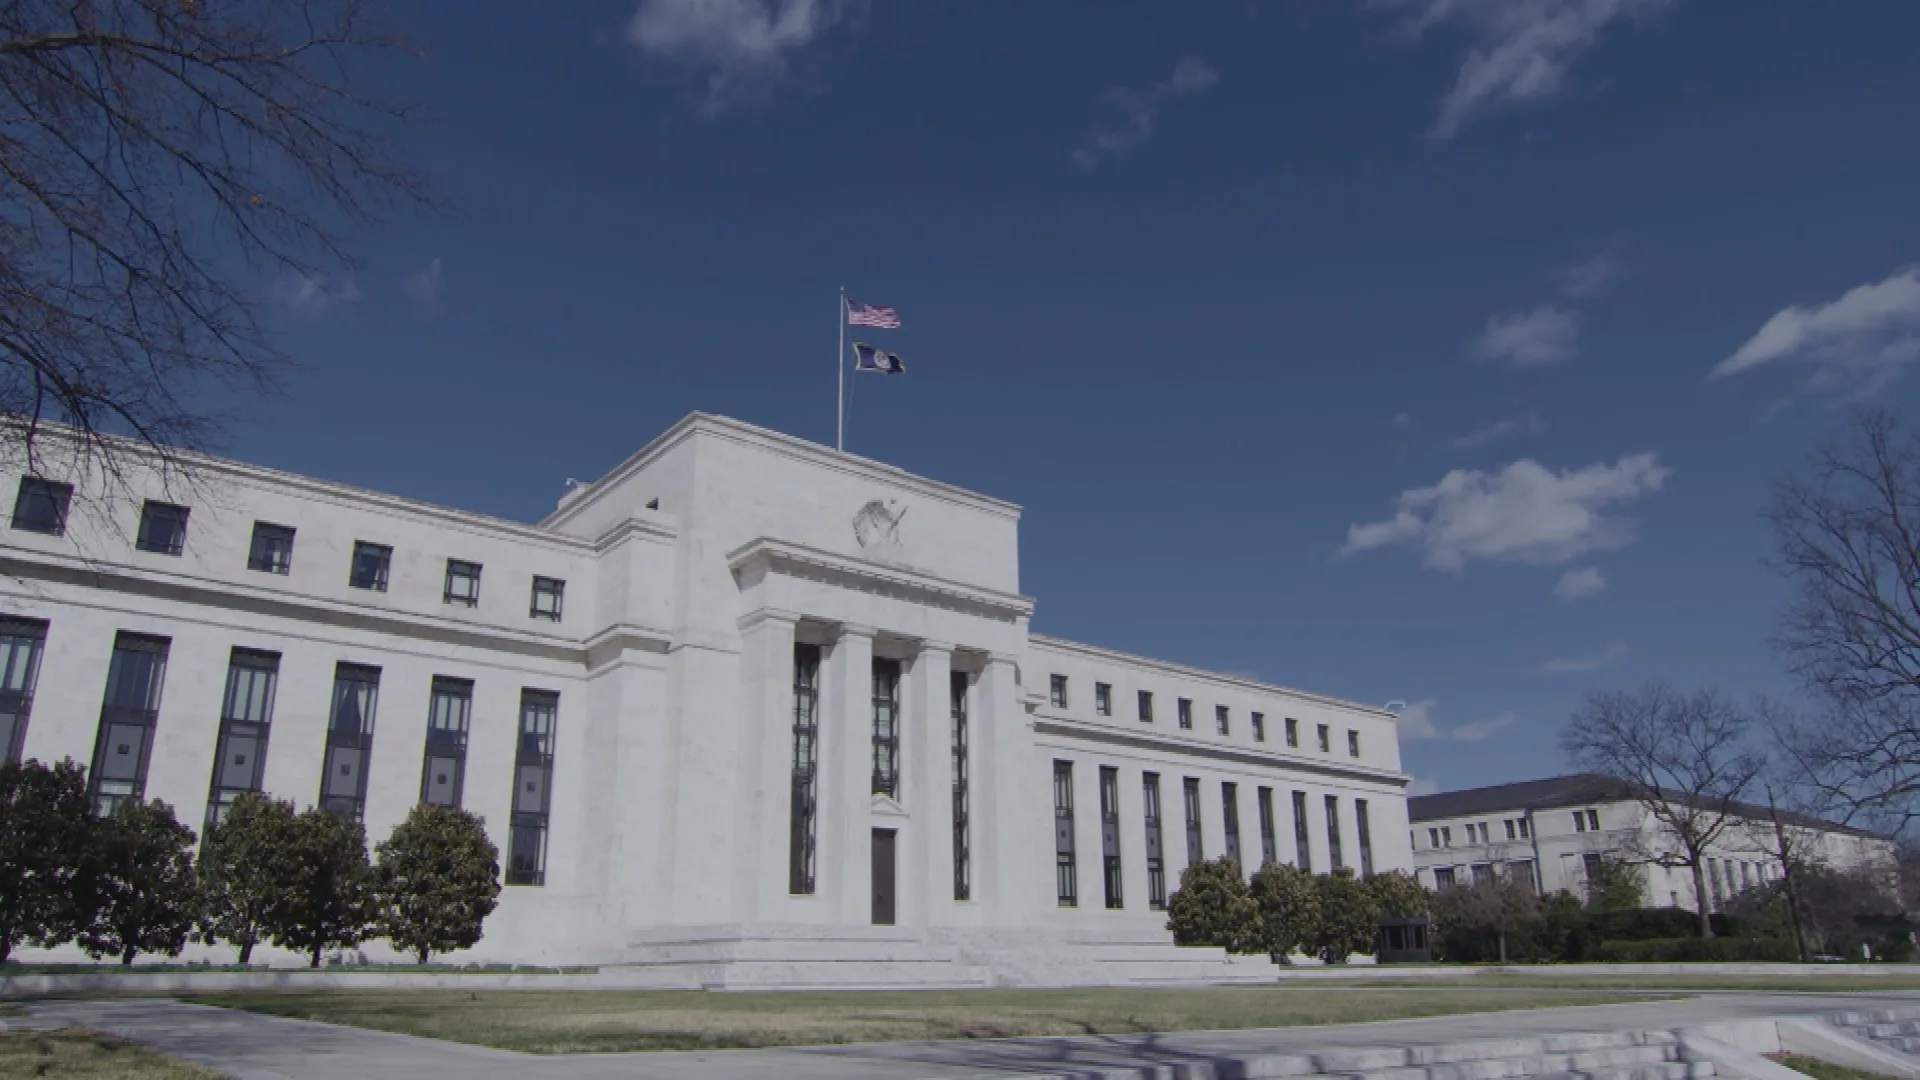
When the COVID-19 pandemic hit, the Federal Reserve tried to avoid economic meltdown by lowering interest rates to near-zero and buying up trillions of dollars in securities — an attempt to make it cheaper for cash-strapped Americans to borrow money and to shore up the financial system.
As reported in the new FRONTLINE documentary The Power of the Fed, that same strategy helped the economy recover after the 2008 financial crisis, but it also left many American households behind.
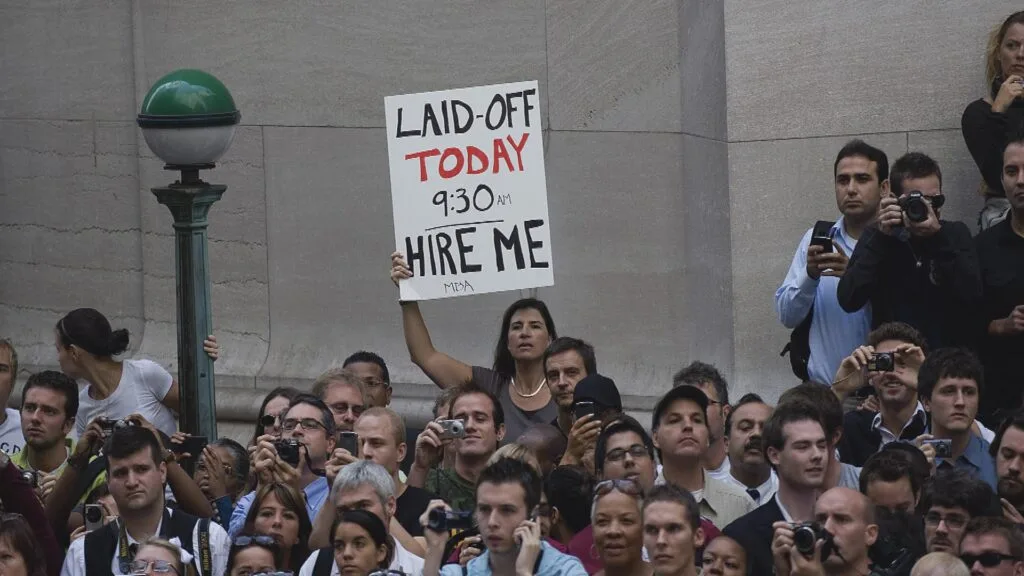
Mohamad El-Erian — who in 2009 ran the world’s largest bond fund, PIMCO — told FRONTLINE the Fed’s response to the 2008 crash benefitted investors more than ordinary American workers.
“The Fed was very successful, in terms of moving asset prices. It was much less successful in moving the economy,” El-Erian said in The Power of the Fed, resulting in what he called a major disconnect “between Main Street and Wall Street, between the economy and finance.”
To illustrate that disconnect, FRONTLINE has charted the performance of two major stock indices — the S&P 500 and the NASDAQ Composite — against the growth of median household income in the U.S. from 2005 to 2019, the latest year for which household income data is available.
According to Michael Ash, a professor of economics and public policy at the University of Massachusetts Amherst, median household income is a useful tool for assessing how ordinary Americans are faring: “a good Main Street measure of economic wellbeing,” he told FRONTLINE.
Growth of the Stock Market vs. U.S. Household IncomeCharting percent change, 2005 to 2019
- Household Income
- S&P 500
- NASDAQ

FRONTLINE obtained median real household income data from FRED, an economic database run by the Federal Reserve Bank of St. Louis. FRED uses the definition of income from the U.S. Census Bureau’s Current Population Survey Annual Social and Economic Supplement, which includes retirement income and pensions but not capital gains or property sales. Historical S&P 500 and NASDAQ values were sourced from Yahoo Finance. To compare stock values to real income, which is adjusted for inflation, FRONTLINE divided the S&P and NASDAQ numbers by the Consumer Price Index, a standard inflation measure released by the Bureau of Labor Statistics.
In addition to streaming below, The Power of the Fed is available in FRONTLINE’s online collection of documentaries, on the PBS Video App and on FRONTLINE’s YouTube channel.
Former Abrams Journalism Fellow, FRONTLINE/Columbia Journalism School Fellowships

Lead, Digital Design and Interactive, FRONTLINE
Email:
dan_nolan@wgbh.orgRelated Documentaries


Latest Documentaries


Related Stories

Age of Easy Money

The Federal Reserve’s Big Experiment
The Power of the Fed
Related Stories
Age of Easy Money
The Federal Reserve’s Big Experiment
The Power of the Fed
Explore
Policies
Teacher Center
![]()
Jon and Jo Ann Hagler on behalf of the Jon L. Hagler Foundation
Corey David Sauer
Koo and Patricia Yuen
FRONTLINE is a registered trademark of WGBH Educational Foundation. Web Site Copyright ©1995-2025 WGBH Educational Foundation. PBS is a 501(c)(3) not-for-profit organization.
Funding for FRONTLINE is provided through the support of PBS viewers and by the Corporation for Public Broadcasting, with major support from Ford Foundation, and The Fialkow Family Foundation. Additional funding is provided the Abrams Foundation, Park Foundation, John D. and Catherine T. MacArthur Foundation, Heising-Simons Foundation, and the FRONTLINE Trust, with major support from Jon and Jo Ann Hagler on behalf of the Jon L. Hagler Foundation, and Corey David Sauer, and additional support from Koo and Patricia Yuen. FRONTLINE is a registered trademark of WGBH Educational Foundation. Web Site Copyright ©1995-2026 WGBH Educational Foundation. PBS is a 501(c)(3) not-for-profit organization.